
JD Edwards
Enabling better decision making with data-based insights
Before you spend too much time and commit too many resources to implementing, maintaining or updating your ERP, turn your JD Edwards usage data into actionable insights.

We are in the age of data-overload – but are we using it to our advantage?
There’s a plethora of information logged everyday through simple daily use of your JD Edwards system.
Connect your JDE to ERP Insights and unlock a reporting studio where you can drive data-based decisions around:
Performance benchmarking and comparison
Usage reporting – What are my users actually doing
Security analysis and historical reference
Quantification of system change
JD Edwards license requirements and optimisation

ERP Insights demonstration
There are so many things we could show you about how ERP Insights can benefit you and your business. We’ve chosen our top three.
- Choosing the correct licensing configuration
- Identify abnormal usage and performance
- Determine optimal security models based on detailed user activity
1. Choosing the correct licensing configuration
What do we see?
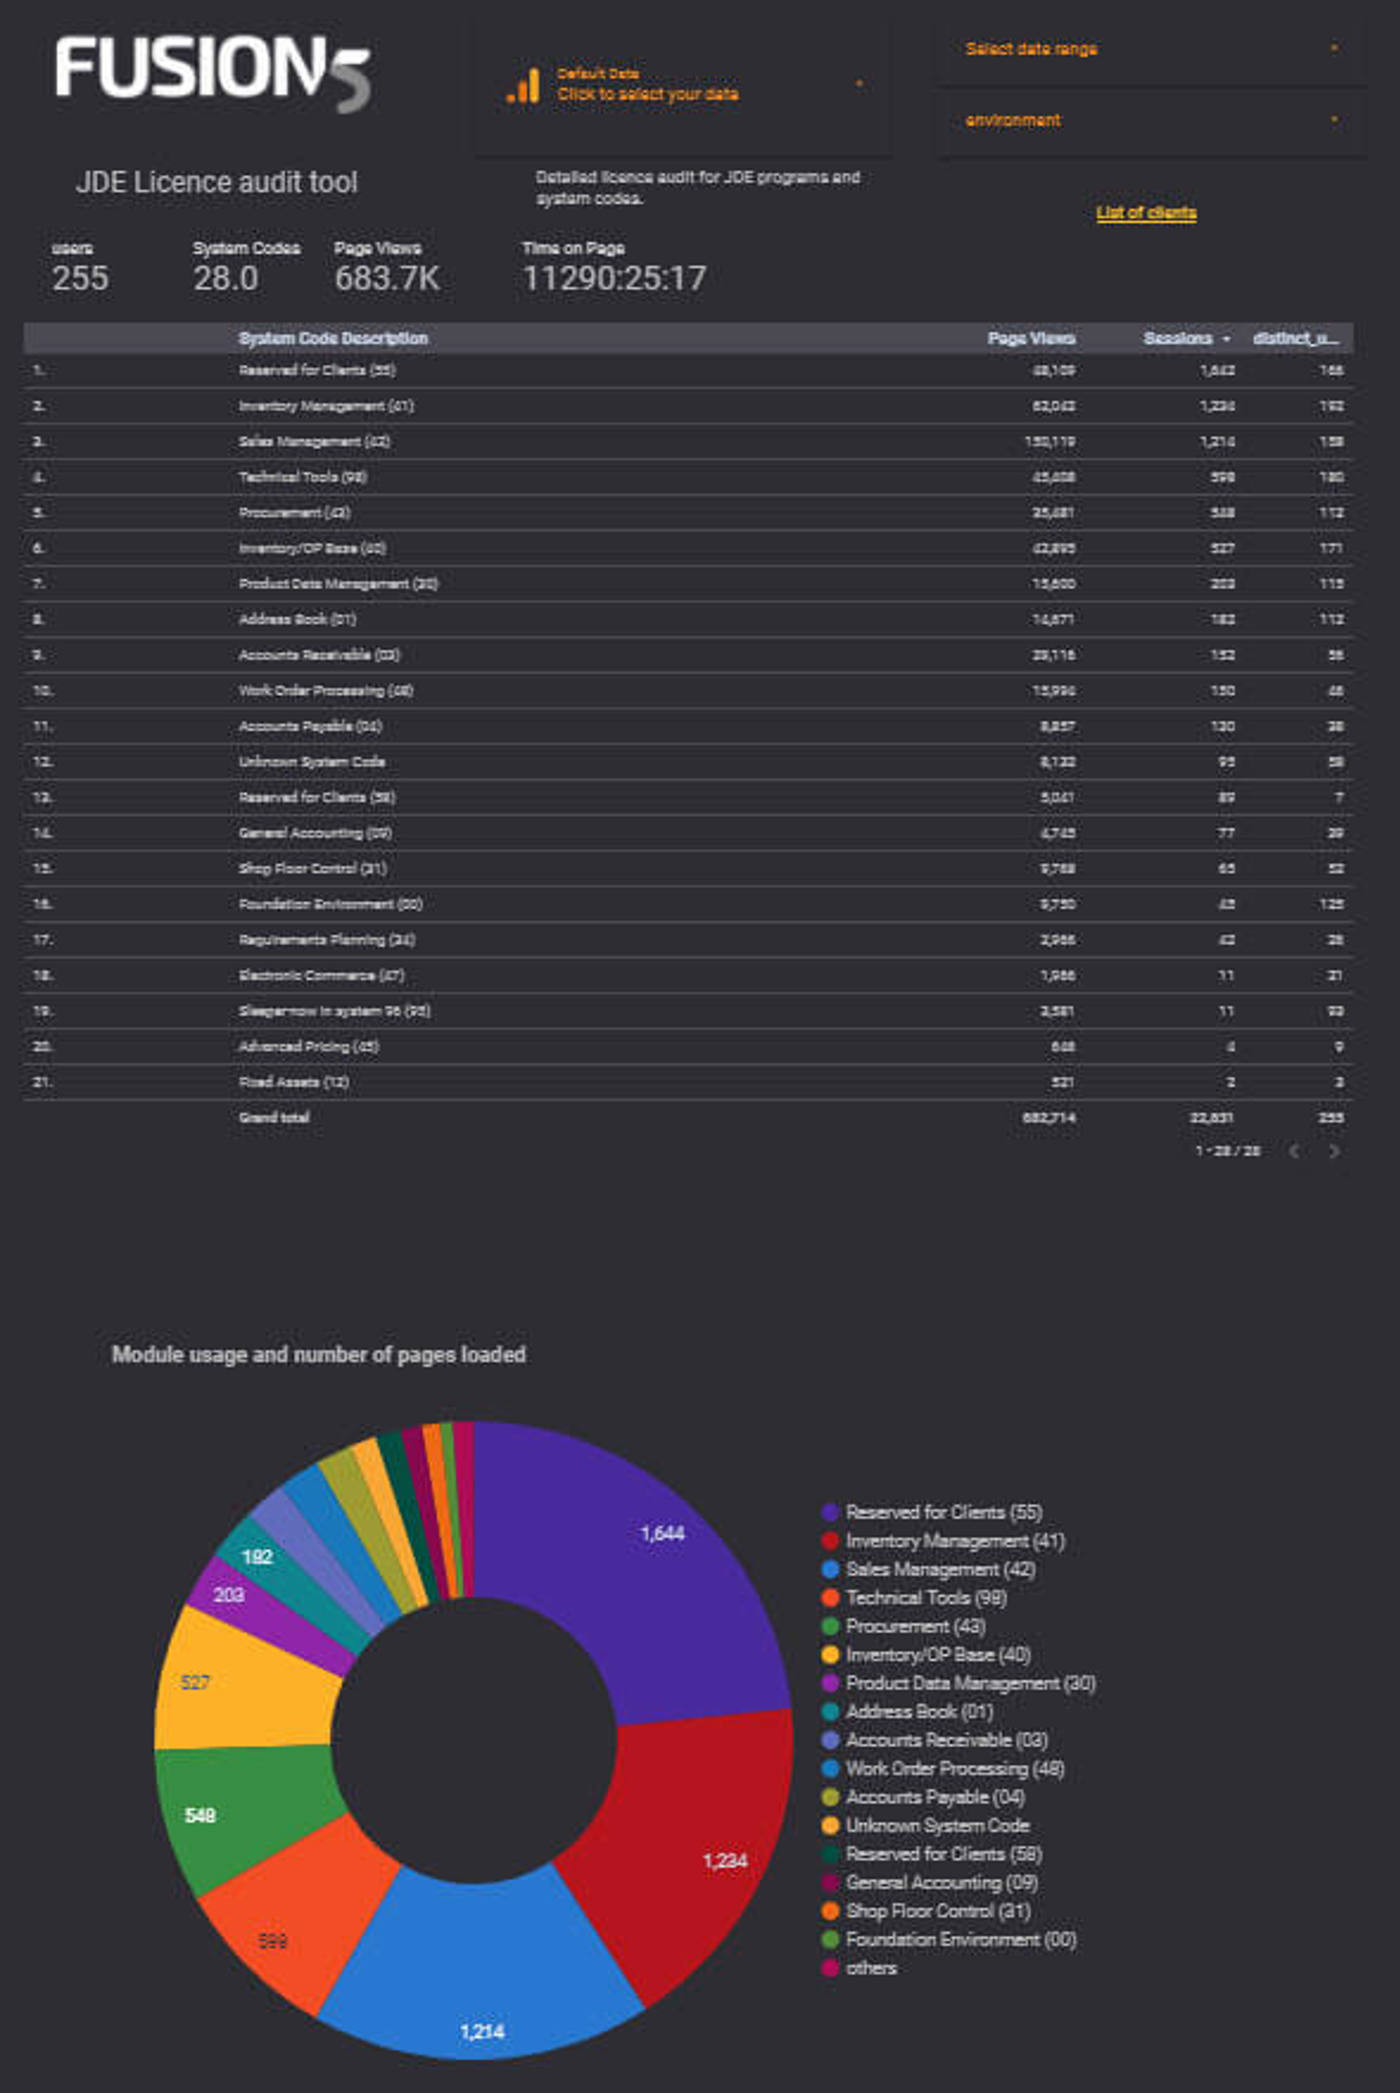
In this ERP Insights report, you can view all of the JD Edwards usage divided by system code for the specified date period (defaulted to the last month). The data can be further divided by country, city or state (depending on network architecture).
The report shows how many people are using each module. You can drill down to specific programmes to confirm that you are working within your JD Edwards licensing boundaries and view historical trends on modules usage dating back to the time ERP Insights was installed.
Why is this important?
If you’re audited by Oracle, and you’re found to be over your license allocation, you will be fined. Without visibility, JDE customers are reliant on Oracle advising them on their module usage, based on a ‘best guess’.
ERP Insights proactively provides you with actuals on module usage, allowing you to optimise your licensing and avoid fines, and ensure your organisation can be confident it is leveraging the correct modules, and using the system to best effect. It also allows you to easily see where you can save money by divesting yourself of duplicate ERP licenses.
2. Identify abnormal usage and performance
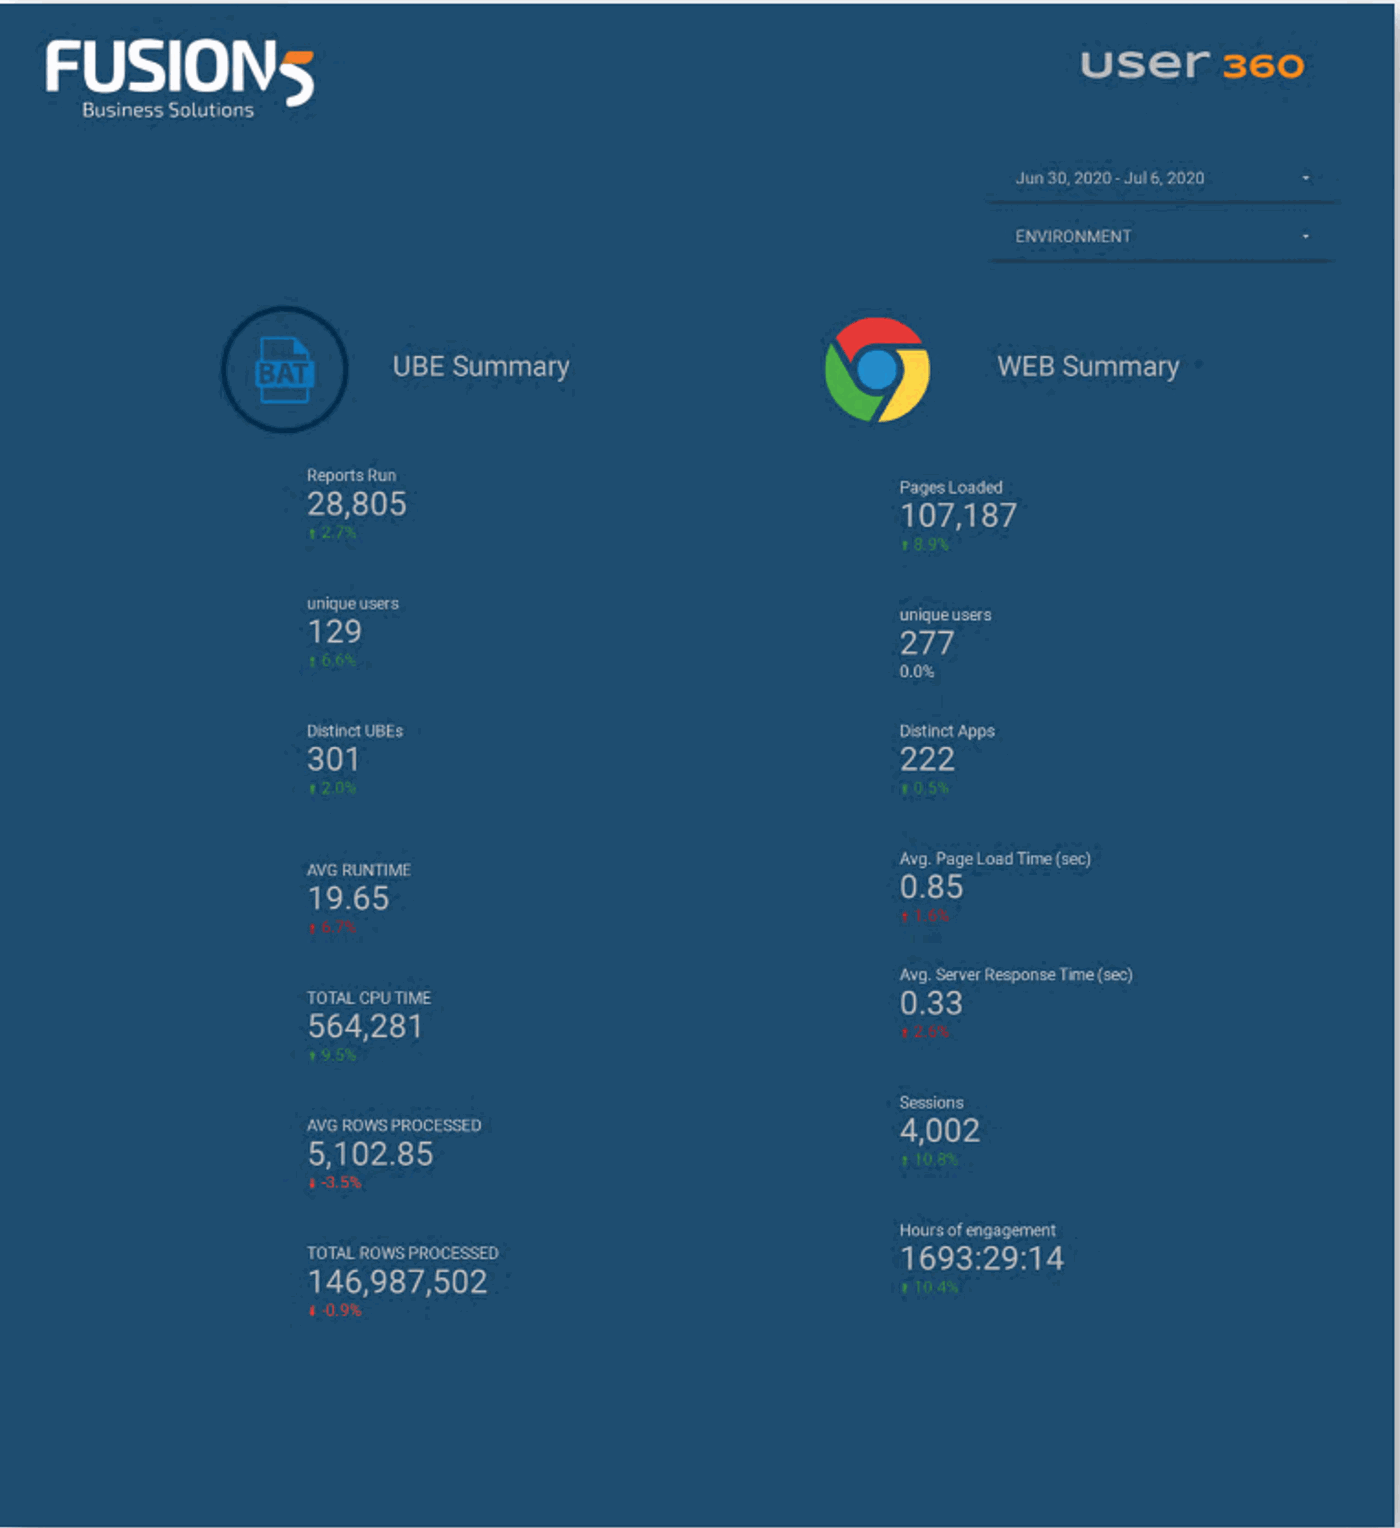
IMAGE: Summary of system performance, by week. This is a high level management summary of JDE for the week, comparing the previous week. It can show any changes to performance or productivity quickly.
What do we see?
This ERP Insights dashboard provides a high-level summary comparing what happened last week vs the week prior.
You can change the period to be as long as you want, the comparison will be against the equivalent previous period.
With this information, you can quickly determine if things are normal in your system. You can also choose production or other environments to determine if testing is going well.
Why is this important?
Whatever period you choose, you can quickly see whether your system’s usage and performance has increased or decreased.
Tracking trends around usage and performance puts you in a strong position to identify issues early and take swift action to address them before they negatively impact productivity and incur extra costs. You now have a benchmark to check the impact of changes to infrastructure and more. What's more is that this is one of the key views in ERP Insights that will help you reduce your technical debt - ultimately ensuring a smoother more cost effective instance.
3. Determine optimal security models based on detailed user activity
What do we see:
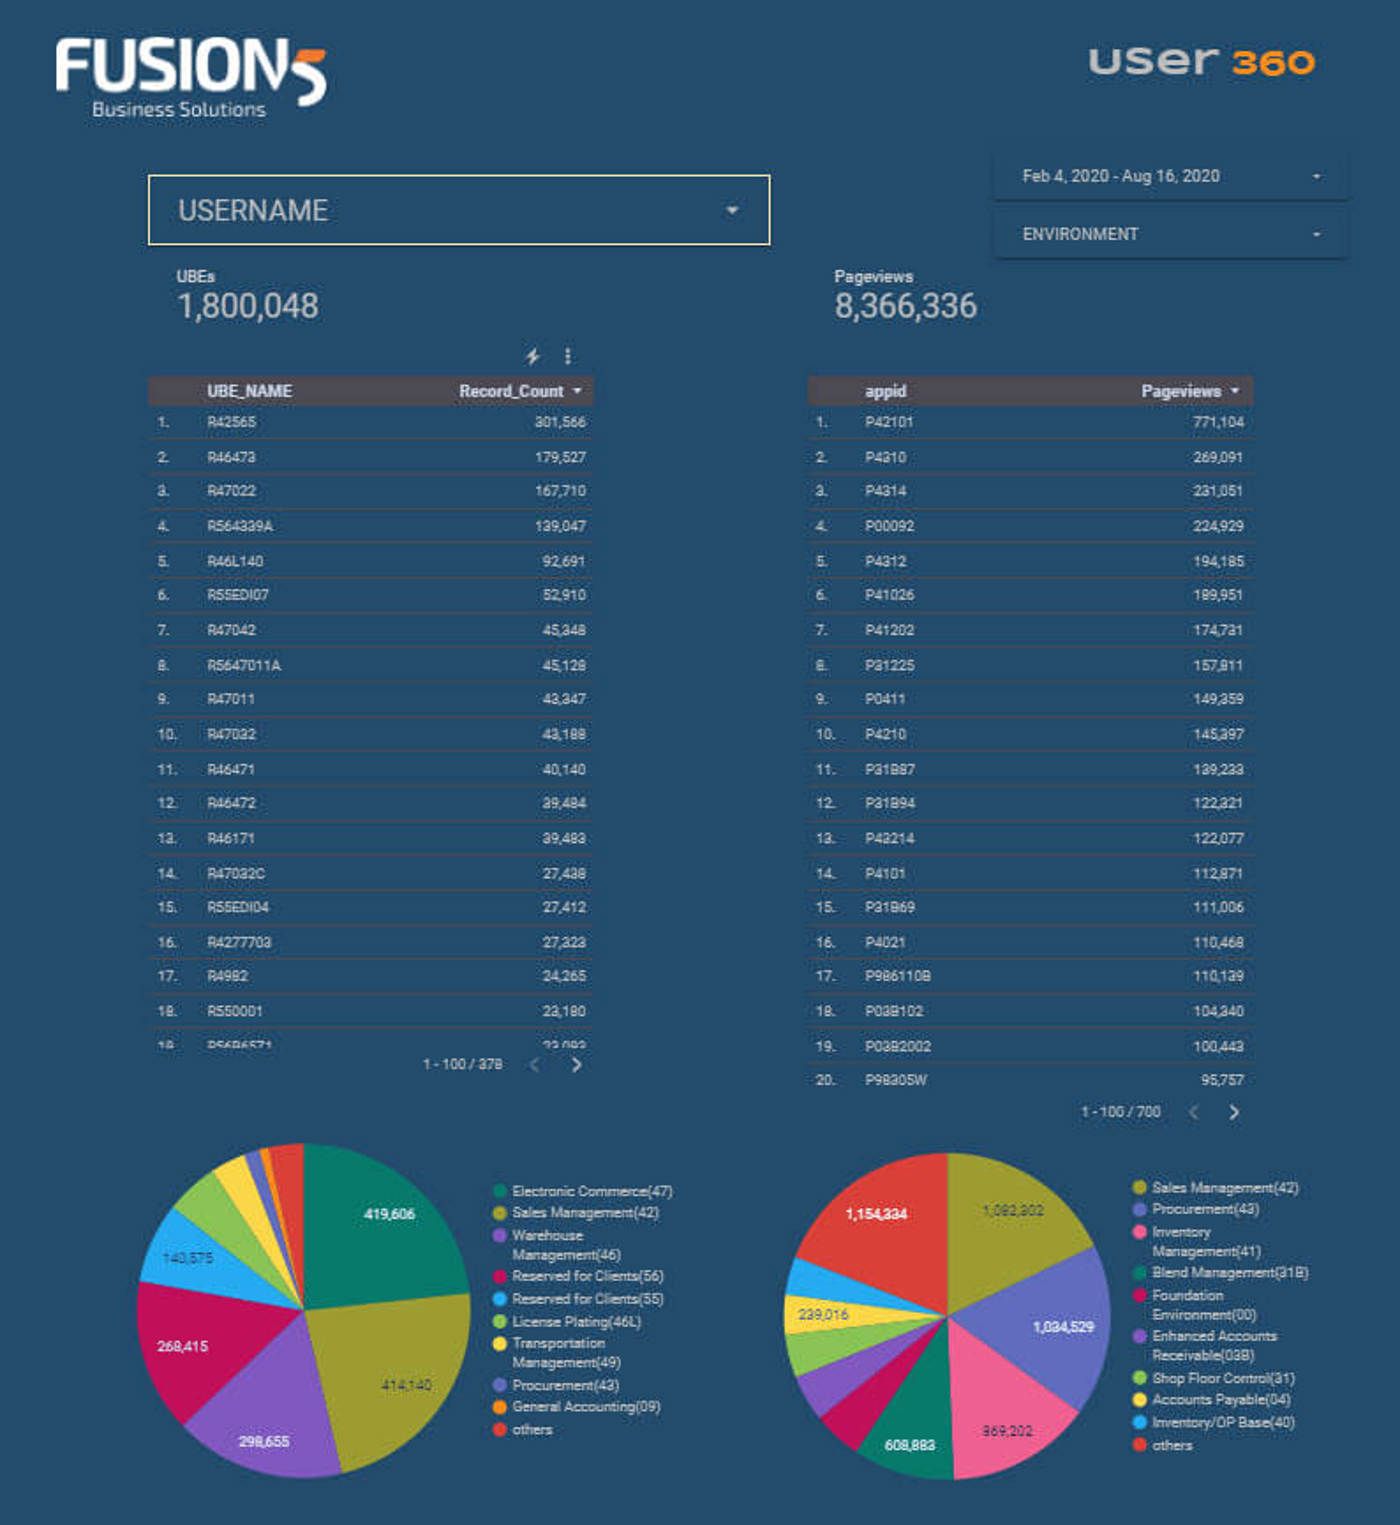
This is a complete summary of the last week of batch and interactive activity in JD Edwards.
You are able to filter on system code or on a particular user.
Seeing the entire environments activity, month on month, can assist to ensure that certain tasks are being performed (like sales updates).
Seeing the difference in behaviour week on week and drilling down to key users can assist in determining optimal security models and productivity.
You can easily see what activities are being done in test environments too, it’s very important to measure the testing that is being done.
Why is this important?
Focus and tailor testing on what is important to the business based on actual usage, to reduce costs and time linked to an update or upgrade. It also provides an accurate checks and balances record on testing and impacts.
This report can give valuable insights into team performance, helping identify training gaps and process improvements that can save time, and increase efficiency.
Finally, this report gives you the ability to build a security model based on actual usage, avoiding costly assumptions and ill-fitting ‘out of the box’ solutions. This can also improve your audit compliance, identify your segregation of duty risks, and ultimately saves the business time and money at audit time.
Alternatively, here are a couple of short videos that may interest you.
